This is my attempt of describing where Linux power consumption measurement is, the handover of metrics to virtual guests, and the current riddle I see for attributing consumption to processes.
Overall system consumption
So this works reasonably well: Performance Co-Pilot with pmda-denki are work reasonably well for measuring, storing and visualizing the power consumption of whole systems. Reasonably well for various investigations which I’ve shared here on the blog.
The next challenge is attribution of consumption to single processes. Right now we can say “this system is running MariaDB, is constabtly consuming 100Watt power”, so then neglecting operating system processes we could say “we can attribute these 100Watt to MariaDB”. Nice and tidy.
If we have a data center with always just a single big application on each system, and no virtual guests, we can also sum up consumption of all of the systems running MariaDB, the systems running PostgreSQL and so on, and have a reasonable overview. Link to pmda-denki and power attribution docs.
Why do we want attribution?
For a number of reasons, examples:
- You are on a plane with a charged laptop battery, no option of recharging. You want to watch recordings from the last Chaos Communication congress, and want to compare whether VLC, mplayer or Firefox uses least energy for playing the recordings.
- You are a company and evaluate 2 softwares which both full fill your requirements: which one uses least energy?
- As a company, you want to monitor consumption of applications over time. Is a software consuming more after an update?
- As a developer: you are not only interested in the performance impact of your last commit, but also impact on consumption.
pmda-denki and PCP can help with much of this already, but there is much room for improvement.
Processes and Virtual Guests
In the real world, your webserver is running Nginx, PHP and PostgreSQL - all on the same system. If we want to notice future PHP updates consuming more energy, we need attribution by application, or process.
What if all of my applications run in KVM guests? I also want to do proper attribution of the applications inside the guests. On the hypervisor, if I manage to do an overall attribution of consumption to the guest (“the webserver KVM guest uses 50Watt”), then I can get that metric (50 Watt) to code inside the guest, and there attribute to single processes.
For all of this to work, we are right now facing 2 obstacles.
The attribution to single processes is working by some means (see obstacle two below), and we can get a top-like overview of how much the processes are using. Not bad.
Obstacle one: Communication with the Guest
Some colleagues and me were pondering about this for a while. As a proof of concept, we can overcome this through the power of PCP, with the following components:
- On the hypervisor we run the code for attribution to processes, so we get metrics for the current consumption of all processes. Example: “the process of KVM-guest1 uses 50 Watt”. This gets available in PCP’s pmcd, a daemon. Simple code can query it over TCP/IP, and it gives us the metrics: KVM-guest1 uses 50 Watt, KVM-guest2 uses 100 Watt, and so on.
- In the guest, we can setup networking, fetch the consumption metrics which was computed on the hypervisor, and pick out our own matric: “I see, I’m a guest and use 50 Watt now”
- With that, the guest can then by itself look at it’s processes and attribute the 50 Watt to single applications/processes.
That works and is nice, but not really a longterm solution. It needs networking to be up, and code in the guest to query the hypervisors pmcd.
First approach to solve the handover into the guest: RAPL. RAPL is Intels interface to share energy consumption data with operating systems, this is the most heavily used source to query overall systems consumption. pmda-denki and other software can use this data. Code got written to have KVM-qemu offer RAPL metrics to the guest, just like real hardware. The code was discussed on qemu-devel@, but ended up to complex to be taken into distros like RHEL9 for example. Also: it’s x86 only. Ideally we would want something also for ARM, RISC-V and so on.
Last year, I aqquired a Power-Z device: it’s a 100$ hardware. It has
- a USB-C input, i.e. coming from a power supply
- a USB-C output, i.e. going to a computer whose consumption we want to measure
- a USB-C data connector: over this, it offers the current power troughput via an API.
The API is available over USB-serial, with just a small additional
Linux kernel module, which is part of the upstream kernel. So..
why don’t we make the metrics available via this interface?
Qemu-KVM seems to already implement usb-host, so we could get an
easy channel from the hypervisor into the guest? Seems like Fedora
has the required support,
‘qemu-system-x86_64 -device usb-serial,help’ looks good. But how
to get it into virsh config? That’s one TODO.
Obstacle two: The current attribution twist
Well, the other current obstacle is an oddity regarding the attribution. My current take on the consumption-attribution to processes is here, and the docs are here.
Let’s start with: the whole attribution is full of compromises. If a single system has all cores (the main power consumer) busy with MariaDB processes, we can attribute the overall systems consumption to MariaDB. The current approach is just considering CPU load, we are using a metric which is available from the PCP framework:
$ pminfo -f proc.psinfo.utime
proc.psinfo.utime
  inst [1 or "000001 /usr/lib/systemd/systemd"] value 3810
  inst [2 or "000002 (kthreadd)"] value 0
  inst [3 or "000003 (pool_workqueue_release)"] value 0
  [..]
  inst [9169 or "009169 /home/chris/[..]/steamwebhelper"] value 40
  [..]
We see here references to the processes: the PID and the command, and then a counter. Looking at this output again after 10sec, we see the counter increased - if the process was running on CPU cores. Under the hood, this metric comes from Linux’ /proc/PID/stat : it’s a counter value in units of milliseconds.
For the consumption attribution, we run a daemon (‘denkid’) which is taking data from pmcd, doing computations, and writing output to a textfile which pmcd is then reading and making available as metrics again.
Ok, so with this, we can already get the top-style ranking here:
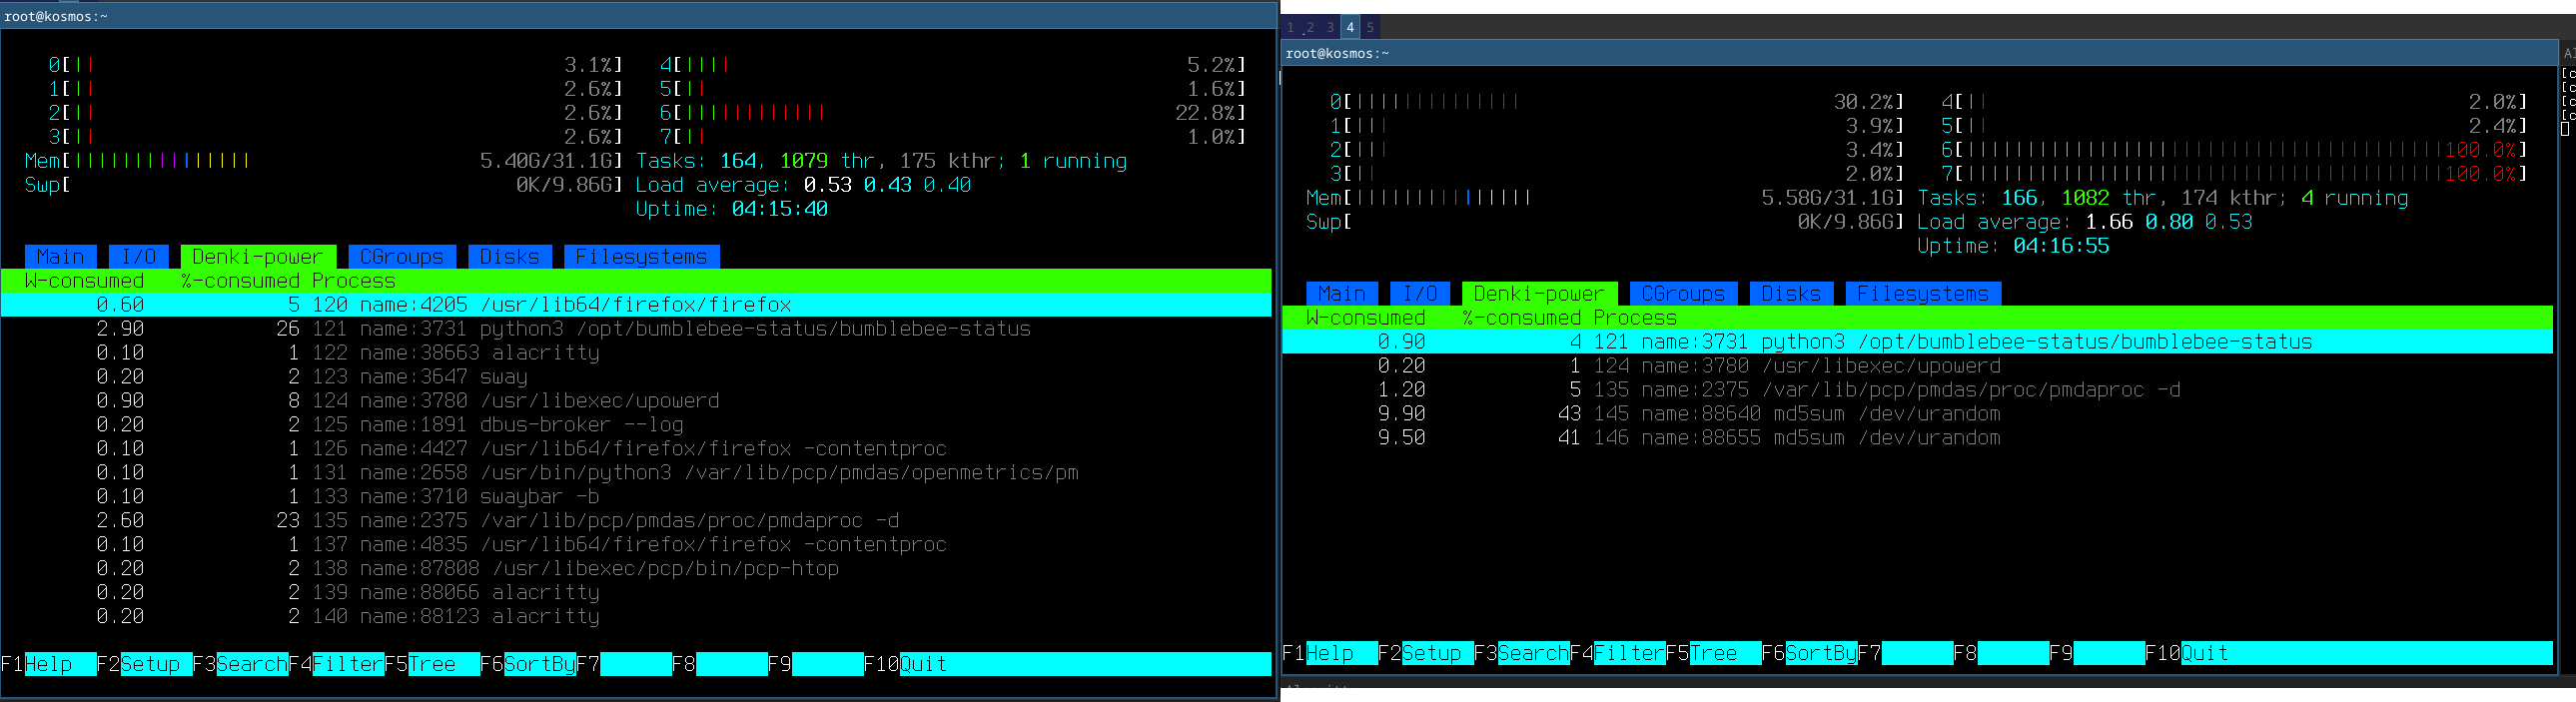
The sorting is still not working in version used for the screenshot, fixes are in PCP-7.1.2 and later.
Now, let’s see how far this brings us under some scenarios!
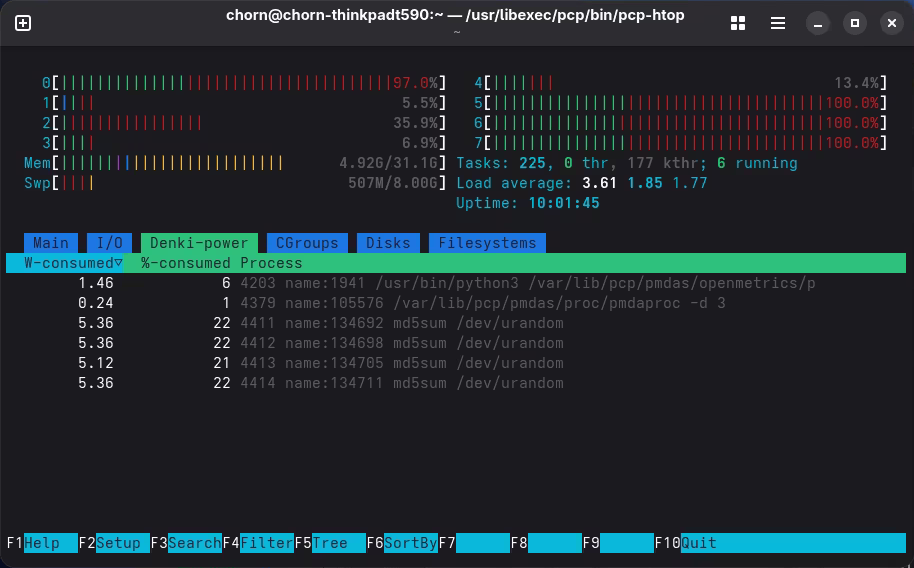
Test1: Consumers on hypervisor
Running 4 processes on hypervisor (i.e. ‘md5sum /dev/urandom’), where each occupies 100% of one cpu-core. No KVM guests running or running but not generating considerable load.
- Expected: denkid is assigning each of the 4 processes 25%, and also ‘Watt per process’ should show ~25% of the overall consumption
- State: GOOD
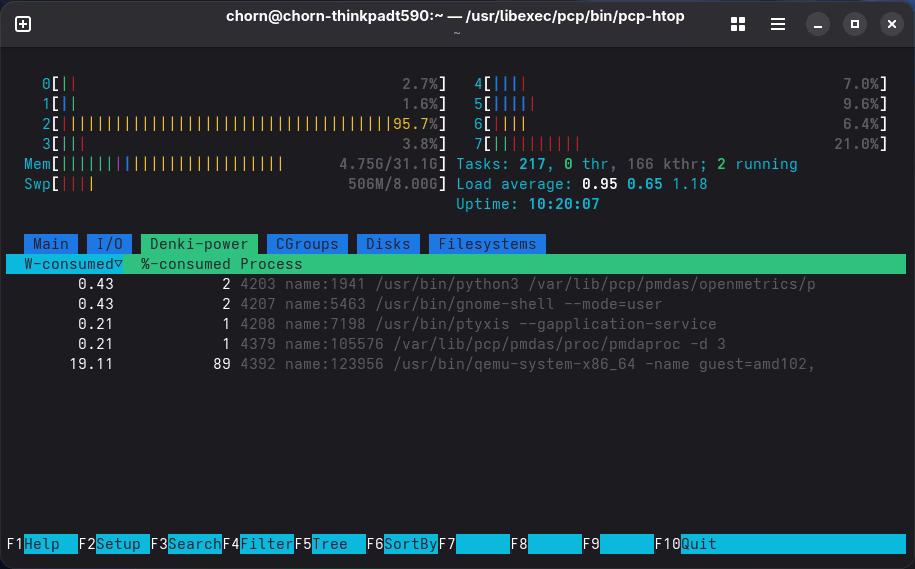
Test2: Single process in guest
Running a single process in the guest, we expect allmost all consumption to get attributed to the guest, that works too. The load from the guest appears here yellow.
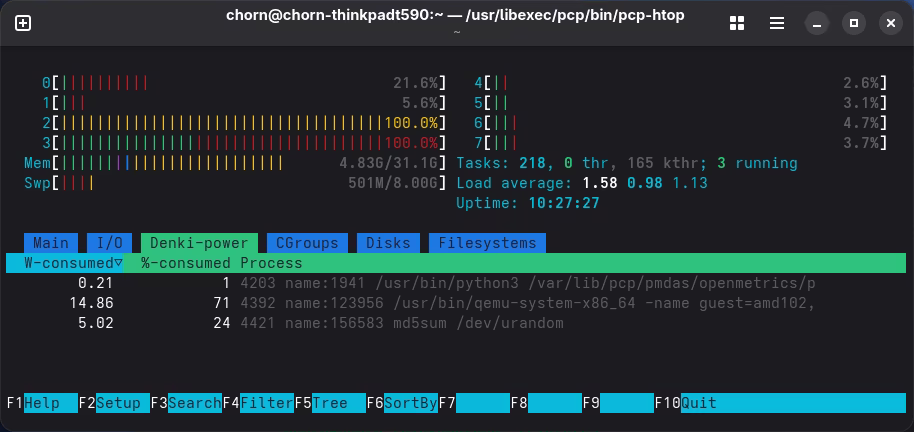
Test3: Mixed load hypervisor & guest
We run 1 process on hypervisor (i.e. ‘md5sum /dev/urandom’), which occupies 100% of one cpu-core. 1 virtual KVM guest running, and running one instance of ‘md5sum /dev/urandom’.
- Expected:
- denkid is assigning the hypervisor processes 50%, and also ‘Watt per process’ should show 50% of the overall consumption.
- denkid should assign 50% of overall consumption to the qemu-kvm process of the guest.
- State: NOTOK. qemu-kvm gets counted much more, i.e. twice of the hypervisor md5sum-process. Odd!
Are my expectations off?
So now we finally have the statement of the missmatch of expectation and outcome. But.. maybe just our expectation is off? Maybe the overhead of emulation is just so big that really the md5sum in the guest is using double resources?
First test trying to find out: comparing “how much work” is done by md5sum on the hypervisor vs. the guest. In our case, with which data rate it is computing the md5sum. To measure, we install ‘pipeview’, it’s showing ’throughput of a pipe’. Screenshot shows:
- on top: consumption attribution
- below: troughput via pv on hypervisor
- bottom: troughput via pv in the guest
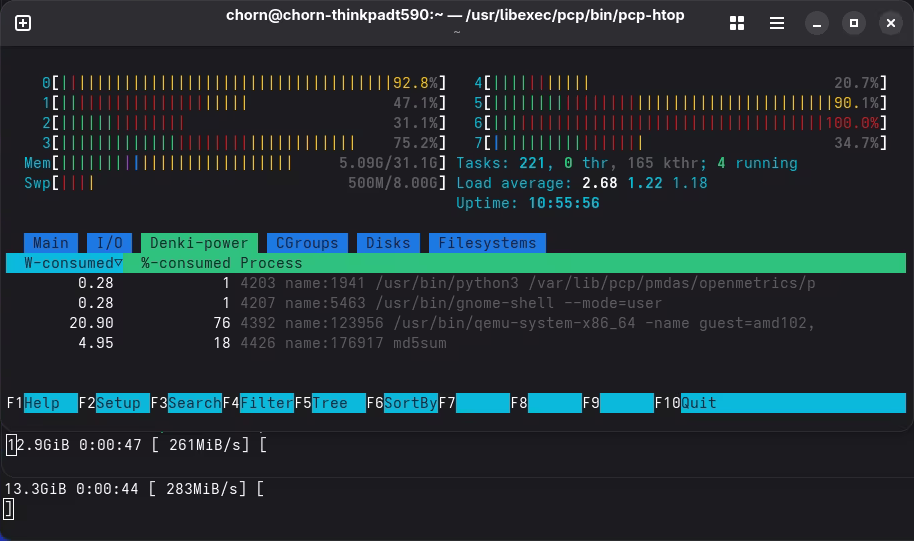
This debugging is not for free.. we got now as complication that we have 2 processes causing load, not only one. :(
Regarding ‘work/performance’ we see the guest does 16% more work, but out attribution suggests that the KVM process did cause 4x the work of the hypervisor process.. hm.
Conclusion: I would not expect much overhead of the virtualization for CPU bound processes. Our guest even performs better, but is accounted much more workshares than expected. I’m still not sure if the accounting is incorrect, or my expectation.
Thoughts/analysis
Observations:
- ‘pcp htop’ shows the qemu-kvm process in yellow. Not sure why. The md5sum is green/red.
- ’top’ properly attributes same to qemu-kvm as to the md5sum process.
- ‘pminfo -f proc.psinfo.utime|egrep ‘qemu-sys|md5sum’’ executed on hypervisor tells us the counters. Executing this with 10sec sleep in between shows that the counter is spinning faster for qemu-kvm, so conclusion: the oddity is not a calculation inside denkid or pmcd, it is already there in the /proc/PID/stat numbers. I confirmed with simple bash code running in loops.
In my tests I see that as soon as the host also is under load, the counter for the guest-process seems to spin faster.
Further debug ideas:
- need to confirm what the plain /proc/pid/stat counter expresses. Bounce this with a kernel specialist. Try to get down to easier reproducer?
- The accounting I use right now seems not ideal. Or is my expectation incorrect?
How to express the power attribution differently? We want to attribute power consumption in the most accurate way possible. We see more consumption attributed to the md5sum in the KVM guest. We assume that there is just a small overhead for CPU-loads. We could try to measure where the energy is going: as byproduct it is heating up the system. We can look at temperature data.. could this help?
We could also try to clarify how sleep states and cpu clock are impacting the consumption. For the tests so far, I used systems with normal power save settings: this is clocking down unused cores, boosting single core under load, or clocking up multiple cores if there is enough load. And does put cores into C-sleep-states if unloaded. If we force the system to maximum clockspeed and to not go into C-states, then unloaded/loaded system will show same power consumption? Acutally, that’s a good experiment to do.
I also had wondered if this is an x86 oddity, but had also seen this “VM with single cpucore-occupying process inside” getting attributed double of the same process natively on the hypervisor.
Well, thanks for following along until here.. the initial version of the article had just the above contents, to order ideas and spark a discussion. And then it resolved. :)
Resolving
As an outcome of the Mastodon thread, the issue got solved. After replacing ‘md5sum’ with a pi-calculator (I used this), it appeared that the accounting was exactly as expected. This screenshot shows 2 processes running on the host, and 2 in the guest, and consumption attribution as expected:
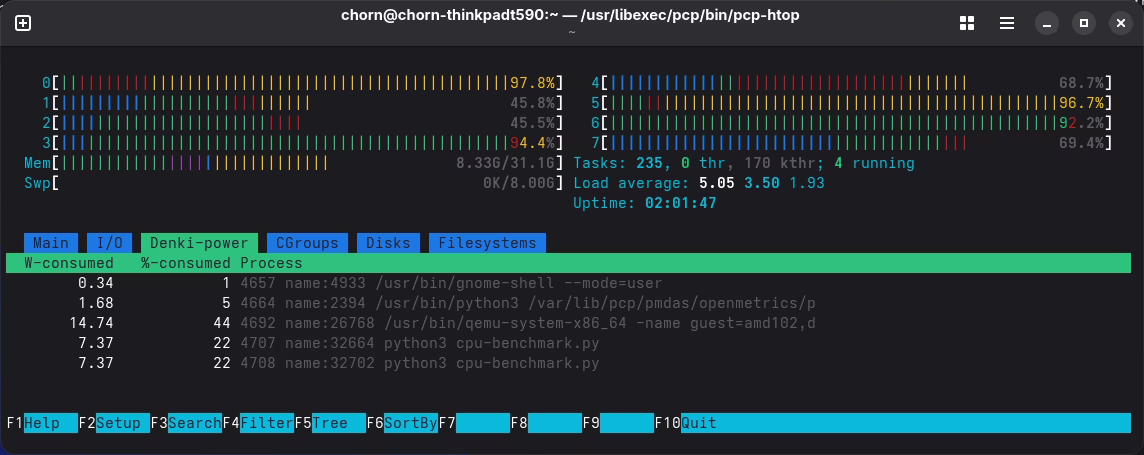
So for “md5sum /dev/urandom”, we saw an additional load on the guest for supplying the /dev/urandom data. The hypervisor spends less cycles, due to /dev/urandom being available differently.
Revisiting the previous ideas
Ok, so with that let’s revisit also some of the other thoughts. On an idle Thinkpad T590, I see 2W overall system consumption.
Single cpu-eater, overall consumption: Running a single
‘pv /dev/urandom|md5sum’ on the hypvervisor, I see 245MB/sec
troughput, and overall system consumption going up to 10W.
Mostly 4 cores run with 2.5Ghz, the others with 400Mhz.
Running the same inside the guest: 265MB/sec, overall 10W, 6 cores at 2.4Ghz and two at 400Mhz. So even with more userland workcycles being done, no increased consumption - I think that’s because not single cores are clocked up/down, and we can do the other ontop workload ‘for free’ without higher consumption.
Four cpu-eateris overall consumption: Running 4 instances of ‘md5sum /dev/urandom’ in the hypervisor, 15W overall consumption, all 8 cores at 2.3Ghz.
Running 4 instances of ‘md5sum /dev/urandom’ in the guest: 15W overall system consumption, all 8 cores running at 2.4Ghz.
Pinning cores at high clockspeed, how is consumption changing? Sample size of one so far, Thinkpad T590: Pinning via ‘cpupower frequency-set -d 2.3Ghz’, we see this implemented via ‘/proc/cpuinfo’, and ‘pminfo hinv.cpu.clock’. Idle consumption stays at 2.8W, maybe system lying to us about clockspeed? Intel’s powertop is reporting 4W idle power, and also no change after we force the cores into 2.3Ghz. I should revisit this on ARM/Apple silicon. I also did nothing about C-states for this test, so allowed cores to go into deeper C-sleepstates.
Corrections? Questions? -> Fediverse thread