TL’DR
- With a Linux laptop, you can quite accurately measure the systems current overall power consumption while on battery. This allows to compare if the new version of your software uses more power than the old one.
- On Intel/AMD systems, power consumption of cpu’s can be measured with RAPL - good enough to compare cpu workloads.
- You can read these metrics directly from sysfs and do some simple computations, or use the PCP/pmda-denki tool. pmda’s are agents, enabling the Performance Co-Pilot (PCP) software to archive the metrics for historical reference, and more.
- From what I have seen, it pays off to choose the software you use wisely: for example, the the applications playing h264 consume different amounts of energy. When you run on battery in a train, that can make a difference.
Why measure power consumption?
We all use ‘powertop’ on Linux to see the current power consumption. Since some time, I was wondering about further ways of measuring and recording the power consumption of my Thinkpad, and graphing it. How much power is used when idling, when I’m not logged in and running powertop? How accurate can one measure the consumption of single components like NVMe disk from the Linux side?
If solid long term measurements were possible, we could answer things like:
- Which software uses least power to show a video file: firefox, chrome, mplayer or vlc?
- When we release new versions of a software, we often compare performance with the older version, for example the time required to compute certain things. But comparing power consumption of new vs. old version could have an impact on how long the Thinkpad runs on battery, and understanding which version is more power efficient can have a world wide impact!
- More illustratively, can I compute how much dead dinosaur (oil) converted to electric energy are used for common tasks?
Hardware power meters
At first, I got 2 external power meters to measure power on it’s way into the Thinkpad. I got the Satechi usb-c meter, which is nice - but I have to read the measurements on the display, they can not be transmitted digitally. To improve that, I got the AVHzY CT-3. The details are here, but essentially: I did not manage to read the measured data from Linux, and the CT-3 seems also for 20V output capped to ~7W, not enough to supply the running + charging Thinkpad.
So how to measure then?
To store recorded values over time, I use the Performance Co-Pilot software. 2019 I wondered about writing pmda-denki slides, pages 25-27, by then considering to use temperature sensors and system load to estimate the consumption. The idea: look at how much the air heats up, and guess based on that how much energy is used to heat it up. That’s possible, but not as accurate as what I ended up with.
The newly written agent ‘pmda-denki’ allows to read various
metrics related to power. I use the following sources in the system:
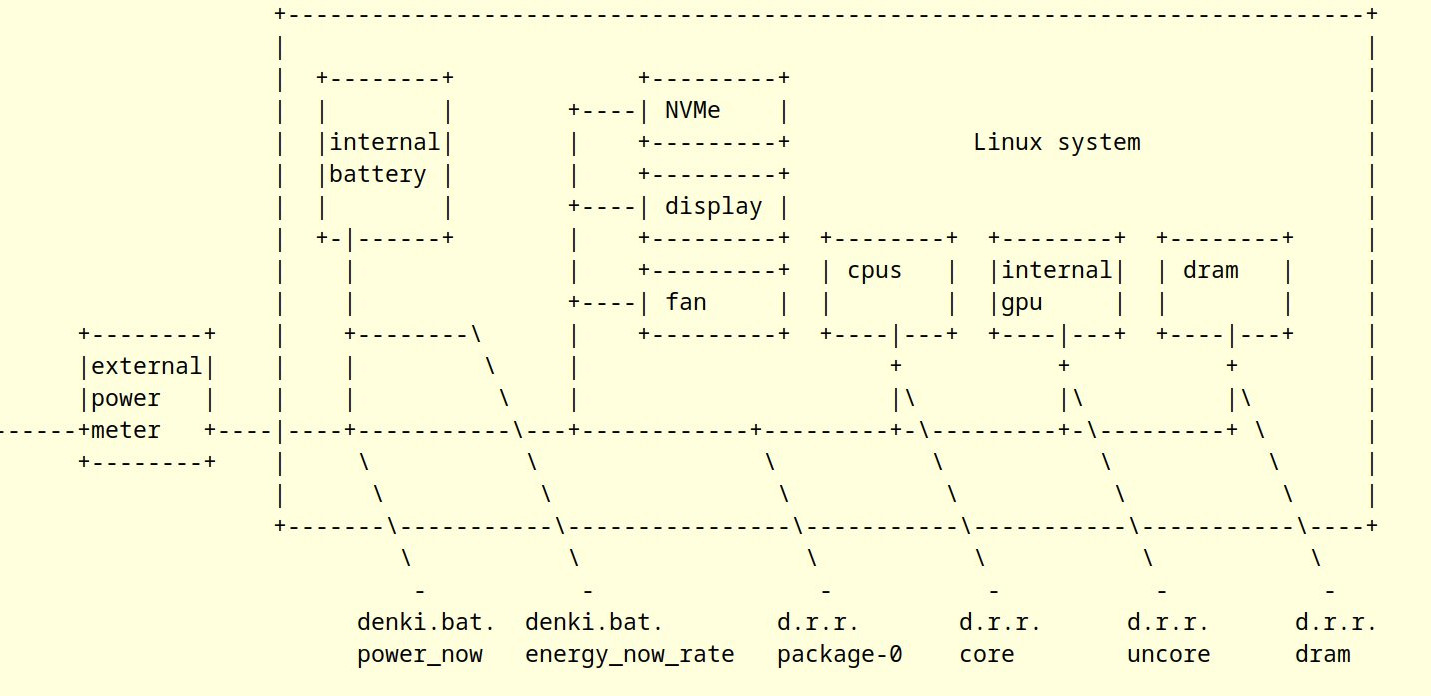
- The cable on the left connects the power supply (not shown), and the external power meter.
- Inside the Linux system, we have the first sensor, the metric gets available as denki.bat.power_now. When external power is disconnected, this metric shows the current consumption of the whole system.
- To the right, we have denki.bat.energy_now_rate. This is computed inside the the pmda-denki software, and tells with which rate the internal battery is charging or discharging.
- Further to the right, we have the denki.rapl.rate.package-0 metric, abbreviated. RAPL is available on recent Intel chips, and shows how much cpus/gpu/dram together consume at the moment.
- The other 3 metrics show the single consumption for cpus, the gpu and the memory.
The 2 metrics on the left are only available on laptops with battery, and only delivering usable metrics when charging or discharging the system. The four metrics on the right are always available on Intel systems.
In the middle, we have further components where we can not directly measure their single consumption: NVMe, internal display if active, fan etc. When the system runs on battery, we have the overall consumption from the metrics on the right, see the readings on the left, and then see how much all in all the other components consume.
So, what’s this ‘denki’ term?
Denki is the roman character representation of the Japanese term 電気, spelled ‘denki’, meaning ’electricity’. Living in Japan, I just always had this in mind for the component collecting electric power metrics.
Any findings from doing measurements?
Detailed measurements are in the second article. System consumption when rendering the great Wipeout webgl implementation: Firefox 20W, Google chrome or chromium use 15W.
With PCP for recording the data, and redis/grafana for visualization, one can better understand charging/discharging:
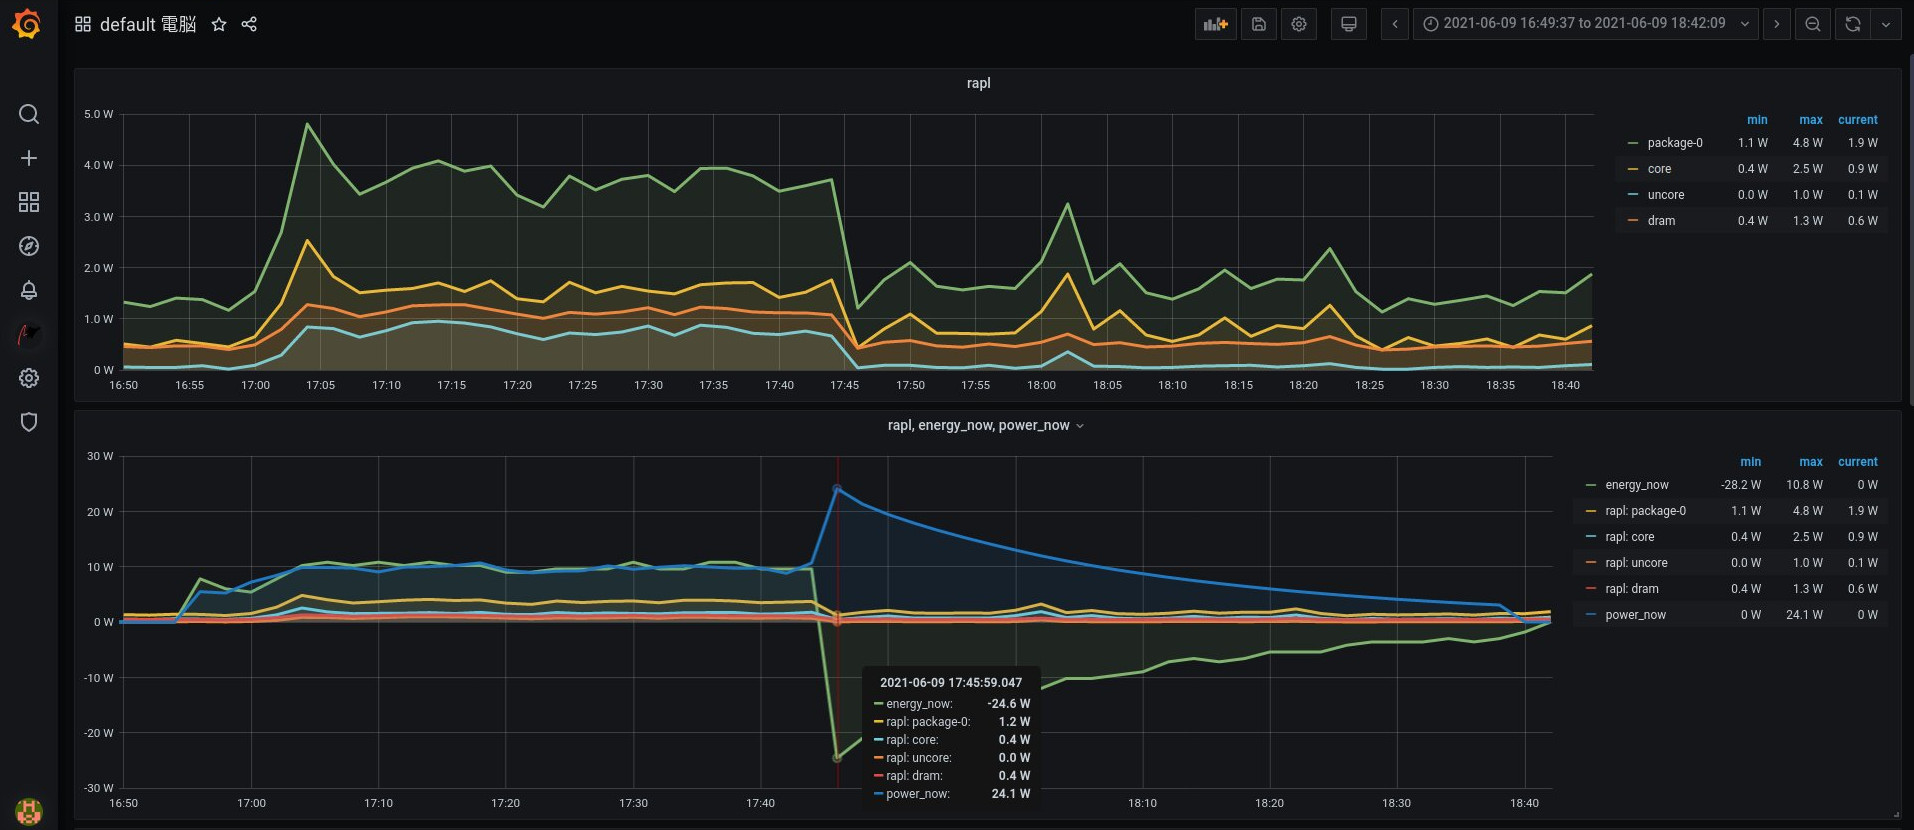
On the top we see purely the RAPL readings, the bottom additionally has the consumption which needs the battery. This is from a desktop. At 16:55, power supply is unplugged, so energy_now and power_now start to report values: overall consumption is around 6W, the desktop is idle. At the same time, the pure RAPL values report 1.5W.
At 17:00, google meet is started, overall consumption is up to 10W, both energy_now and power_now agree on that. RAPL sees 4W.
Around 17:43, google meet is stopped, and the power supply is connected. We start charging, which my energy_now implementation reports as negative value - power going into the battery. To the right we see how charging gets slower, until the battery is full.
power_now is quite directly read from the sysfs. energy_now as it comes from sysfs is the current charge of the battery. My code is constantly reading that and then computing effective charge- and discharge rate.
Conclusion
pmda-denki is merged in upstream, and should be part of PCP 5.3.2 (expected end of July 2021). The raw values for RAPL and the battery metrics can also be obtained directly from sysfs, pmda-denki is just making these available more conveniently, and allows to record them over time via PCP/pmlogger.
There are powertop (for current readings, and hints for optimization), powerstat (vmstat style reports of battery and rapl readings, I used parts of that code) and rapl-plot, also reporting RAPL. libvariorum is trying to be one library implementing power metrics from multiple sources, like for example NVidia cards.
While the system runs on battery, we can measure overall consumption with usable accuracy, so this is a great way for open source projects to verify if their new version needs more or less power than before! Many projects test for syntax errors, testsuites, and performance impact of changes - but we should pay more attention to power consumption. For fighting the climate crisis, and having the laptop running longer on battery.
The second article is here.
Last modified on 2021-06-07