In the previous article I talked about external meters and pmda-denki. Now lets see how much power certain hardware components need.
Pmda-denki usage
pmda-denki is now in PCP upstream. One can use the code from
there, via packages build regularly, or wait for the next PCP
release to make it into the Linux distros. With that done,
and pmda-denki being installed, metrics regarding electrical
power are available. On laptops where pmda-denki can access
both sources:
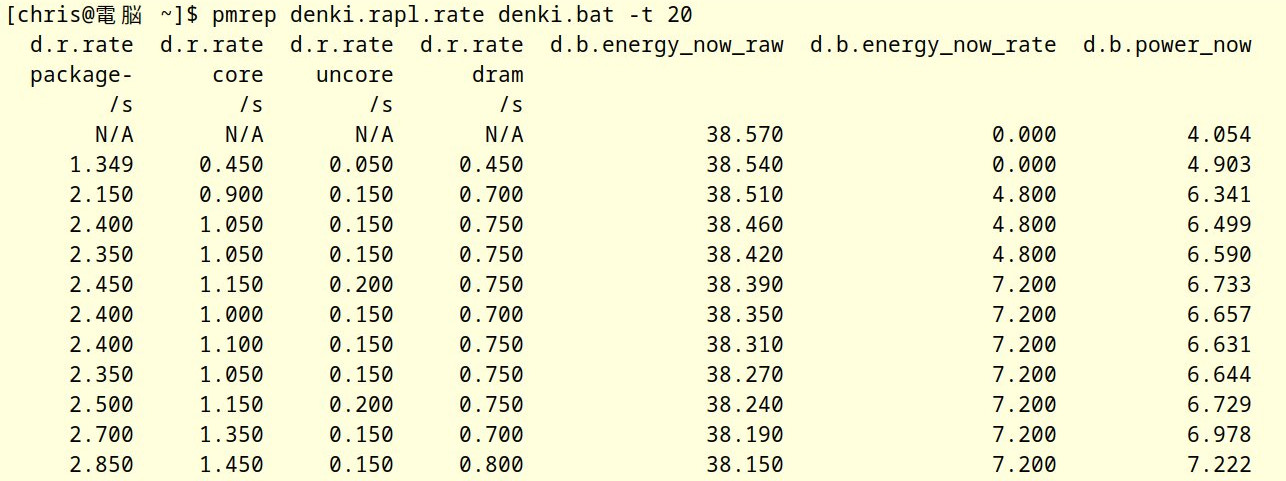
As per ‘pmrep .. -t 20’, in 20second timesteps a new line is printed. From the left, we get
- package: sum of all RAPL values, in Watt. RAPL is available on recent Intel and AMD cpus.
- core: consumed cpu power via RAPL
- uncore: GPU consumption, if onboard-GPU
- dram: memory
All of these are actually counters from the sys-filesystem, and PCP computes the actual rate. The next 3 values:
- energy_now_raw: the current battery charge, in Watthours. Read from sys-filesystem.
- energy_now_rate: rate of charging/discharging, computed by pmda-denki in 60second steps
- power_now: rate of discharging, computed by firmware, updated frequently
Why so many battery values? Let’s consider these graphs:
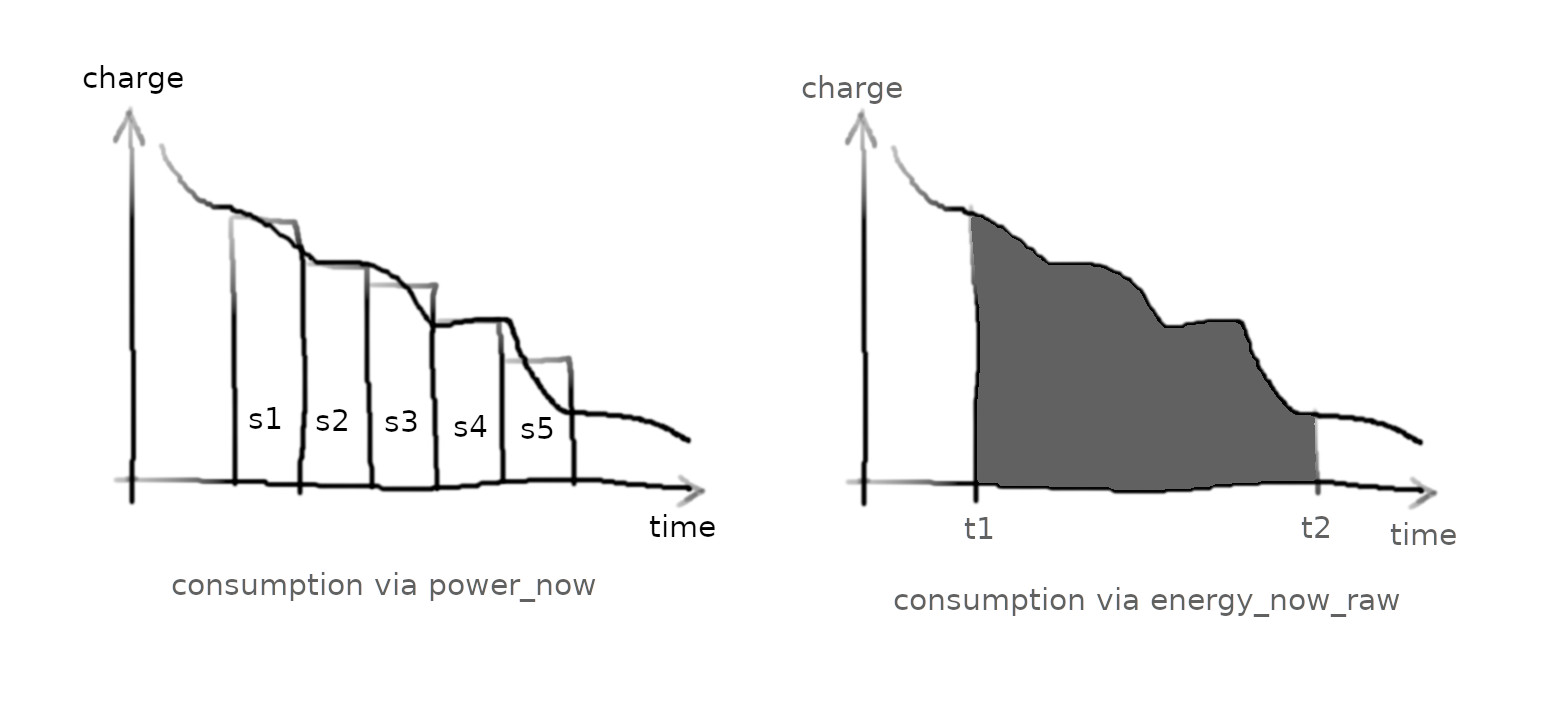
Both graphs show the battery charge level over time, while the system consumes energy. Our application is running, and we want to know the amount of energy consumed while the application was running.
power_now reports current consumption, that metric is updated by the firmware roughly once per second. If we want to know the average consumption over a certain timespan, or if we want to compute the “amount of consumed energy”, then we need to query this metric at least once per second, store all of the single values (shown as stripes s1-s5), and then calculate based on that.
On the right, we use energy_now_raw: this metric has the current battery charge level. The overall consumption between points in time t1 and t2 is the area below the curve. We can simply measure the charge level at times t1 and t2, and then calculate how much energy was consumed in between.
energy_now_rate is calculated by pmda-denki, using energy_now_raw it calculates the rate of charging/discharge in 60sec steps.
So: power_now shows current consumption, frequently updated. For more accurate measurement, energy_now_raw should be used.
What can we do with these numbers?
Hardware component consumption
With the tools mentioned I tried to understand how much single
components consume. For cpu we see it directly from RAPL, but
not for example for wlan. First step: get a systems consumption
down as low as possible, here a Thinkpad T460s. Log in from
via ethernet, turn off screen, run ‘powertop –auto-tune’,
and ’tlp start’, stop unneeded processes. Measure that, then put
single components under stress, and measure again. Results,
raw
data,
graph:
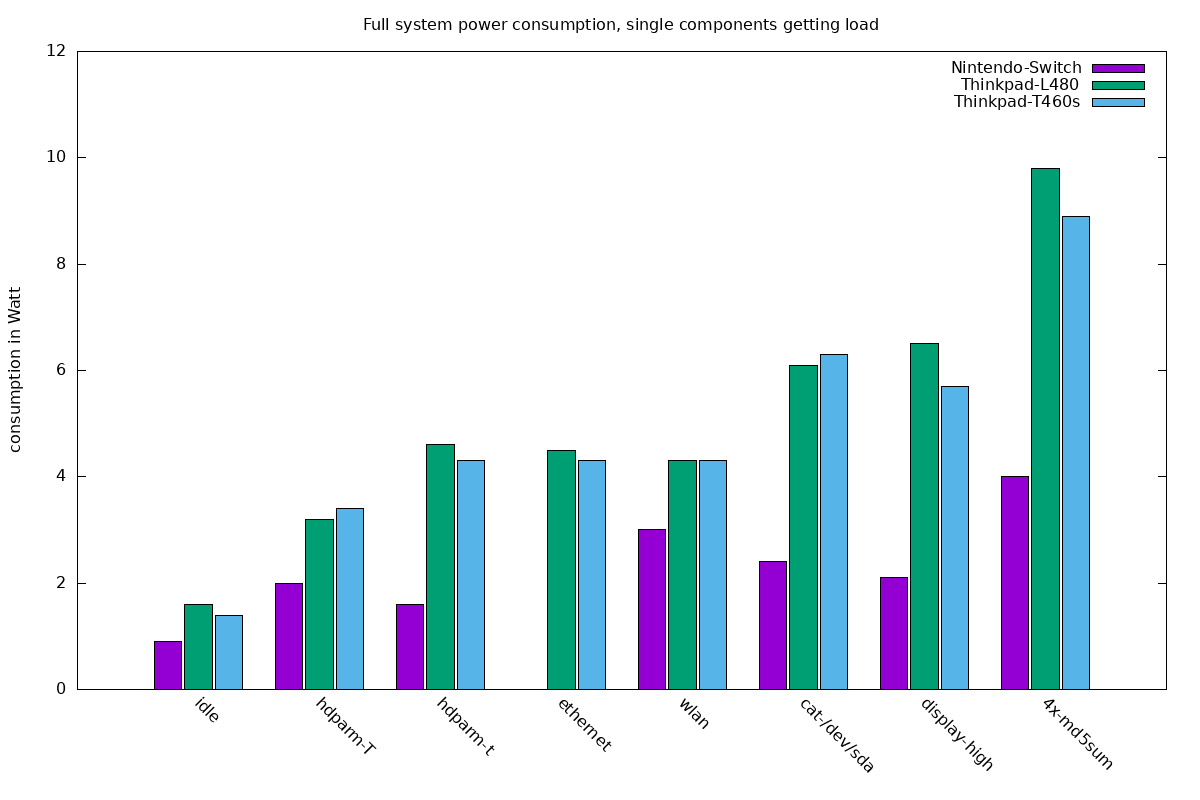
From the left, we see consumption of the idle system. Used hardware: Nintendo Switch (aarch64), Thinkpad L480 and Thinpad T460s. Then consumption while stressing SSD/NVMe, ethernet, wlan, SSD/NVMe + bus/cpu, activated display, and running cpu loads. So far only battery based metrics were used. As we know the idle consumption, we can estimate consumption of the single components:
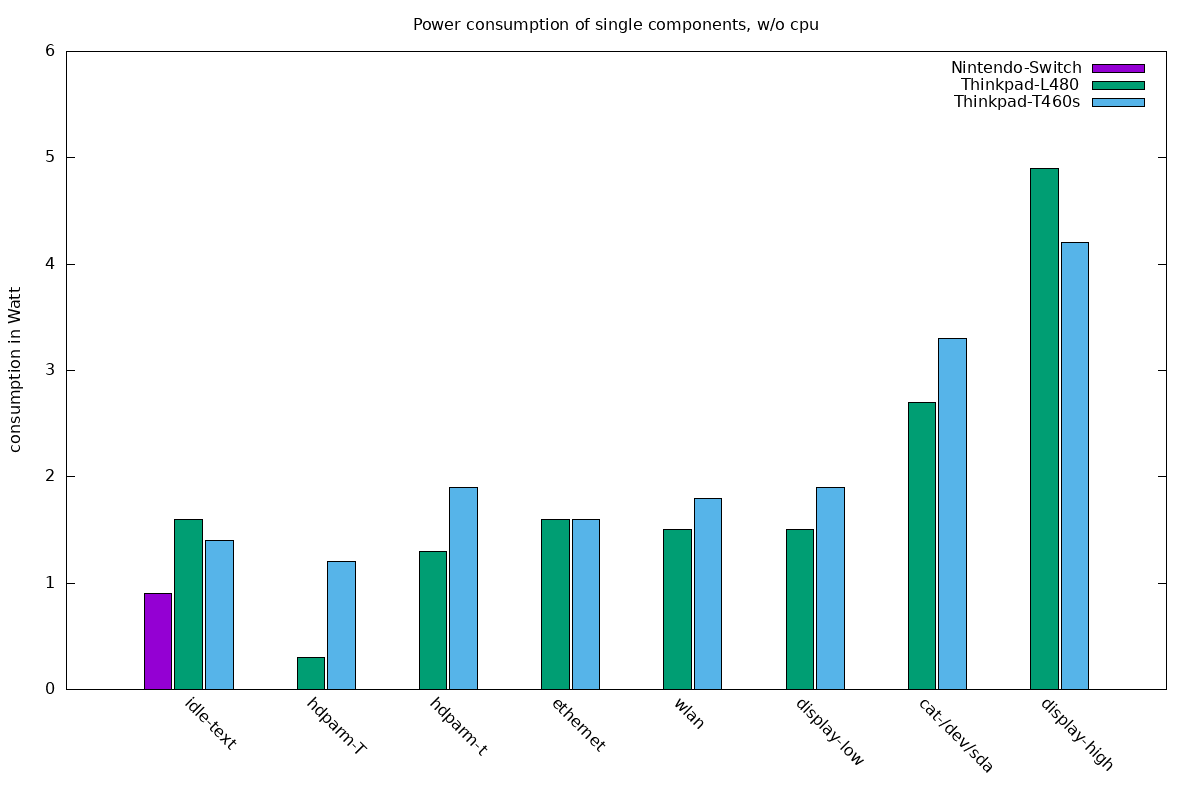
For this, also the RAPL metrics were used - they are not available on ARM. The T460s has an SSD and the L480 an NVMe, thus these differences. The ‘hdparm -T’ tests stay inside the SSD/NVME, the NVMe does not only need less power but also shows 19GB/sec transfers instead if 8GB/sec for the SSD. For ethernet, wlan and the other tests the results are comparable.
Software
For software, these 2 scenarios seem interesting:
- consumption of one and the same software running a workload, but comaring different versions of the software. It’s common to compare speed of new versions, but comparing power would be interesting too in times of climate crisig. energy_now_raw is good for this.
- taking one certain task, and compare how much power various programs need to perform that task. If you sit in a plane with a laptop on battery and want to watch videos, you want to use the software with the lowest consumption.
Let’s look deeper into the second scenario.
Given task, various softwares
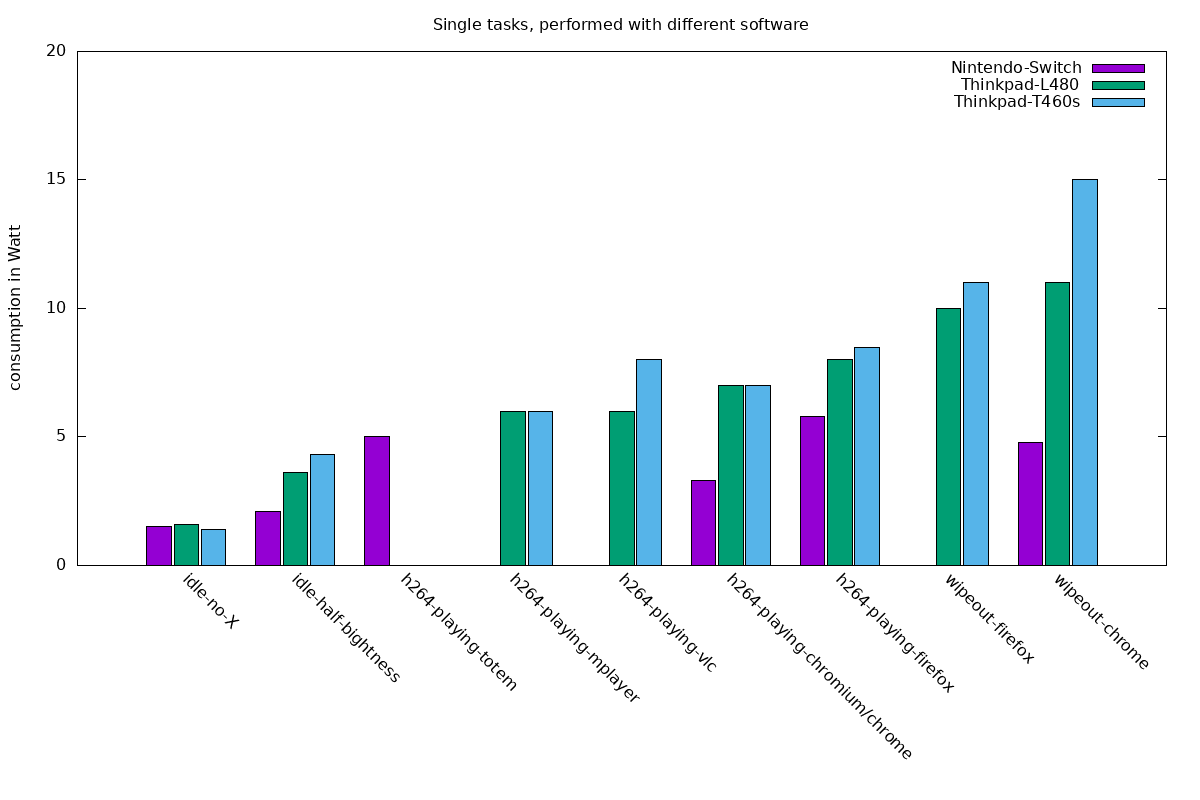
On the left, we have the unloaded system again, then the screen with brightness at 50%. Then for task ‘play this h264 encoded file’ consumption with various software. Specialized software like mplayer/vlc does better than browsers. ARM does energy wise better than x86, that was also expected.
On the right, playing this webgl demo on a browser is the task, and it’s impressive how good ARM does here. We should be fair here though: I did not look at frames-per-second or other quality signs, so it’s possible that chrome renders much more smooth than firefox.
Where is software burning power?
If we can trust the RAPL values, we can also estimate where
software is burning power.
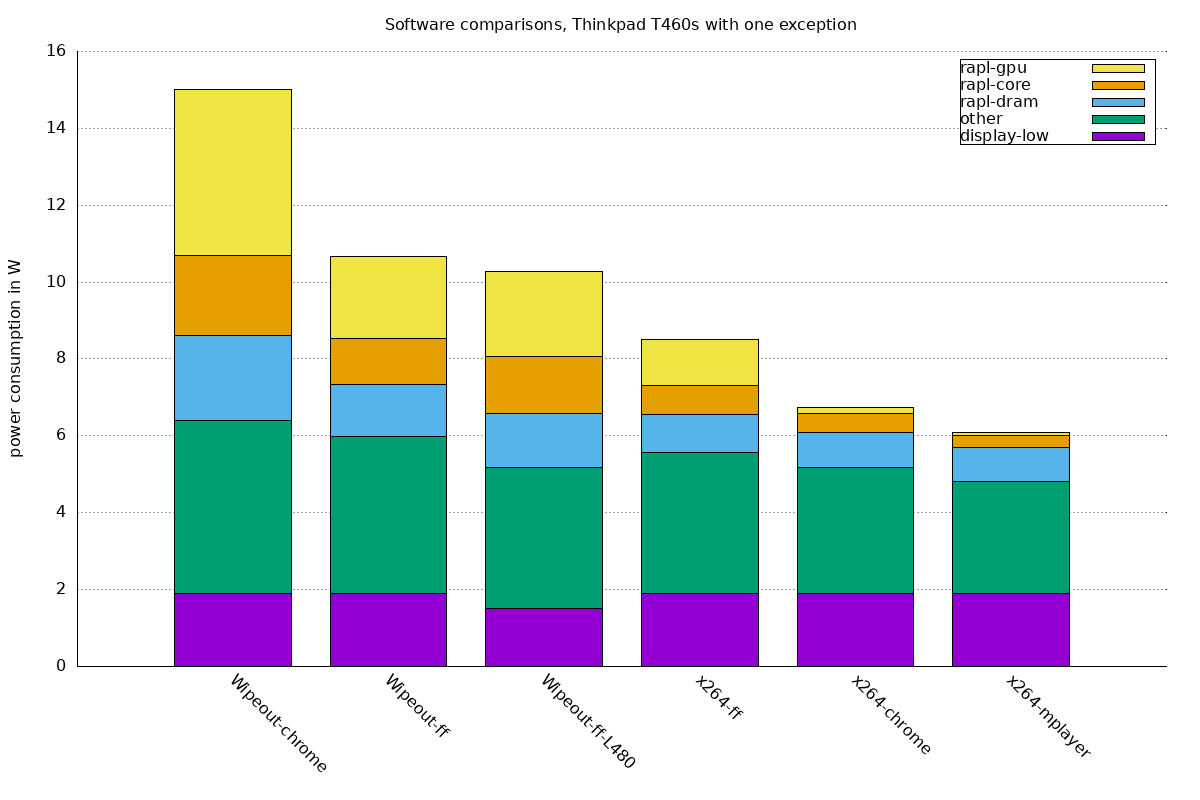
This is all from the Thinkpad T460s, as single exception the values from the Wipeout-firefox-L480 test. We see that over all of the webgl and h264 tests, display and “other” consumption was quite constant. The “other” is basically “everything I can not account more precisely”, after looking at overall consumption (from battery metrics) and subtracting the RAPL values. Wipeout-firefox on both Thinkpads shows almost identical consumption patterns. Differences in cpu and GPU consumption between the programs are big.
How much can we trust these numbers?
Hard to say. As for RAPL, there are studies painting them as “not to bad”. My approach to get an idea on how good the battery metrics are: I used an external consumer via usb, whose consumption I could nicely measure externally. So I used the idle system, hooked up the consumer via usb, measured the consumption externally, and looked at power_now and energy_now_rate.
Results: Thinkpad T460s got a conumer attached with 6.1W consumption as per external meter, while power_now reported 7.8W (already subtracted the idle power, consumed by the system). With a 2.4W external consumer, the sytem reported 2.8W.
For the L480: 15.2W (bat reported) vs. 12.8W (measured), and 5.1W (reported) vs. 4.4W (measured). So if we assume the external meter as correct, we see that the internal values were 14-22% off - but always in the same direction.. so maybe we have 14-22% loss when providing power to usb. The raw data is here.
The software is out, the metrics seem good enough to be used in comparisons - we might see more consumption comparisons in the future. We might also get new power sensors available, providing more metrics. Let me know if there is something which I should have measured!
Software used for this article: PCP, GIMP, mplayer, vlc, chrome/chromium, Firefox, gnuplot.
Links
- The wiki has further details on pmda-denki.
- Article Take control of your Red Hat Enterprise Linux systems’ power consumption with pmda-denki explains the steps to measure energy consumption for a workload
- Article Is a slow but low-consumption system more energy efficient? Let’s measure, with RHEL! uses these steps to compare energy efficiency of various architectures (arm, RISC-V, x86, ..) for a workload
Last modified on 2021-07-04