TL’DNR
Both smartplugs (reporting electrical consumption of a connected device) and the laptop battery allow consumption measurements. Results are in the same ballpark, but also differences of 20% can be seen.
Smartplugs for Linux system power measurement
So far, I only measured power Linux system power consumption with the help of the internal battery, details here and here. Now I got 3 smart plugs for Japanese power outlets which can measure power, and wanted to use these for more experiments. All 3 devices are setup in installing an Android app on the mobile phone, activating bluetooth, and then the smartplugs hook into the local network. While you have the smartplugs directly next to you, all of these vendors intend you to use their Android apps to turn the smartplug on/off, or read the current measured power consumption of connected devices.
For my measurements, I want that power consumption as plain numbers, for scripting ang graphing. It was hard enough to find smartplugs for Japanese power outlets which also can measure consumption, and after playing a bit with these only one allows reading of the consumption via API. For this, I would ideally talk with the smartplug directly via local wifi, but only get that the API from the vendors cloud on the internet. So with that, a script can now query the consumption.
Details of the 3 devices are on the wiki. The one on the left, Switchbot プラグミニ スマートプラグ, has the consumption available via API. The Shelly smartplug I use in Germany offers it directly on the device, and additionally also has a temperature sensor.
There is quite some delay between changes in power consumption and seing the change reflected via API, 3-4 seconds.
Why?
What could be interesting to look at? Previously I had tried to find out how much energy single components in a laptop consume: NIC, display, cpu, NVME-disk and so on. For that, I had looked at how quickly the battery discharges and calculated the consumption of the components.
But how well do the measurements of the battery and the smartplug match up?
Measurement setup
Consumption measurement via battery is only available when the system runs on battery, and measurement of the smartplug only when the system is on the power grid. So I need to create load scenarios on the system, which cause consumption, and then apply the scenarios to both ways of measurement, after each other.
To really get similar scenarios, things needed to be scripted. I use one system to control (‘controller’), and a second system undergoing measurement (SUT, System Under Test). An Ansible playbook is preparing the SUT:
- installing powertop (to easily optimize for low power consumption), upower (to verify battery state), and Performance Co-Pilot (to access metrics like power consumption, and archive them for later examination)
- Activating pmda-denki and pmda-sensors, these provide the metrics for consumption/temperature)
- enable remote access for PCP’s pmcd. The daemon runs on the SUT, and offers the metrics. The controller system is querying the metrics from there and archiving them for examination.
Then, scripts can be run which for example run ‘openssl speed’ on the SUT, and observe the consumption and other metrics. When the test is done for both battery and smartplug measurement, the resulting data gets dumped from PCP’s archive files, and fed into gnuplot.
Some results
Looking at Thinkpad T460s with Fedora and comparing what smartplug/battery report:
| System state | report smartplug | report battery |
|---|---|---|
| idle, screen off | 1.6W | 1.7W |
| idle, screen on | 5.6W | 4.3W |
| cpu loaded | 27W | 22W |
I wondered if maybe the bios is tuning down the cpus when on battery, although I had disabled that in the bios. The RAPL readings help to understand that aspect: they report consumption estimations for CPU, memory and gpu.
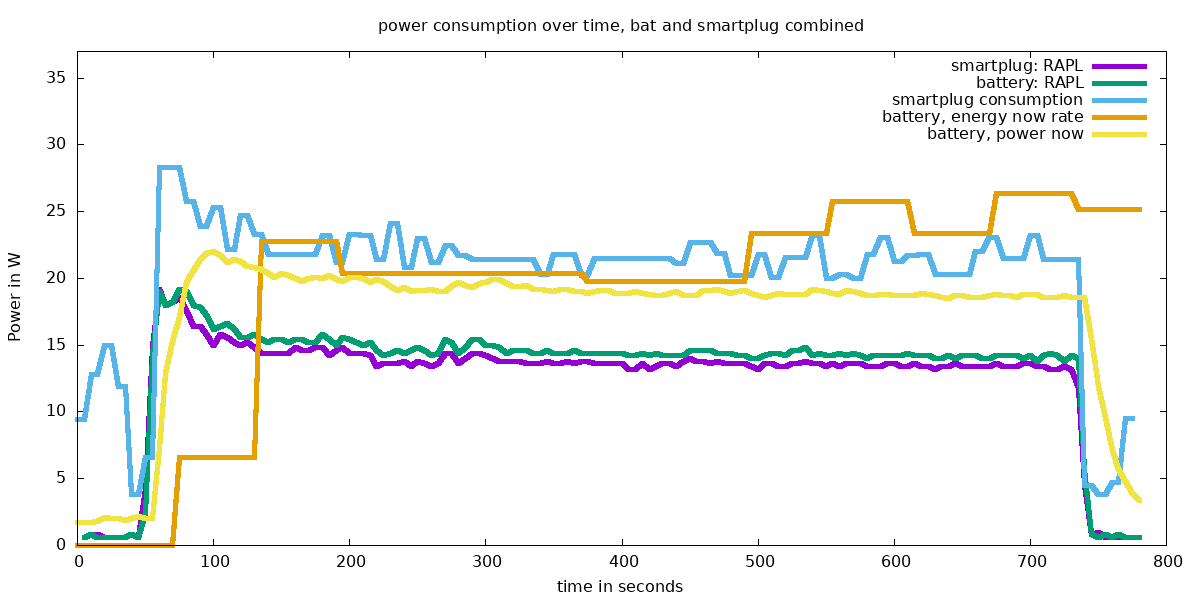
The green and violet curves are the RAPL metrics, so these report here for both battery/smartplug operation comparable consumption, even a bit higher for battery.
The blue curve is the consumption reported by the smartplug, and the yellow line is the consumption as reported via the battery, in many cases as /sys/class/power_supply/BAT0/power_now. This seems to be computed from observing the battery level.
The orange line is calculated within PCP/pmda-denki: in one minute timeframes it looks at the current battery charge level and does an own computation of the current power drain, this is meant as a cross check against power_now/to average over longer time instead of jumping up and down like power_now.
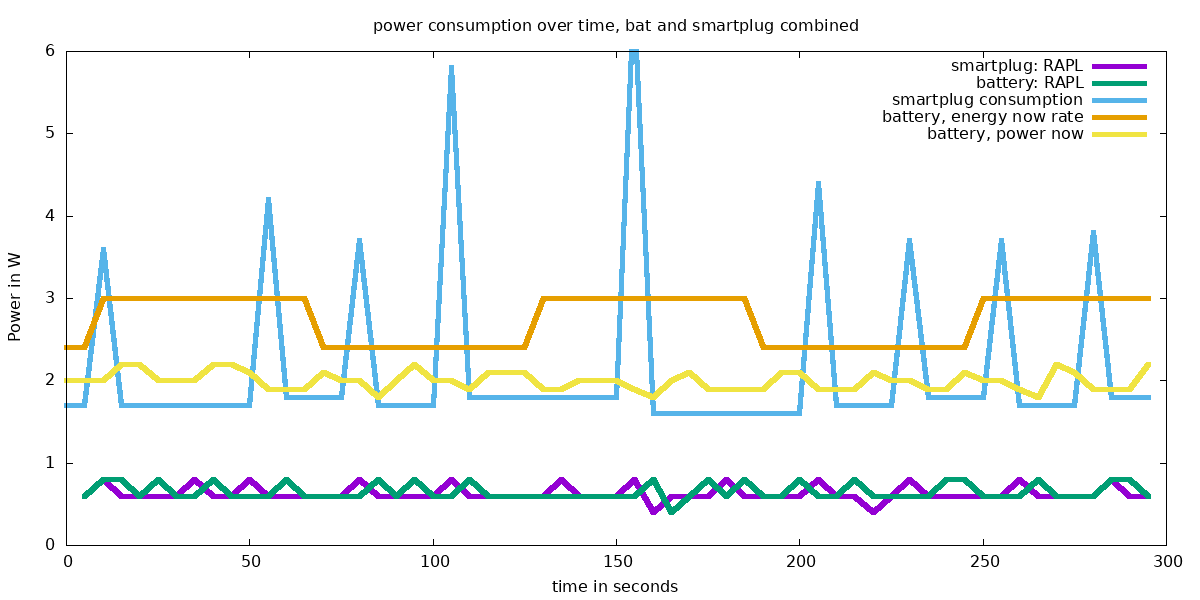
Idle system
Looking at the idle system, green/purple are again the RAPL metrics. Ontop of that we have consumers like nvme-disk, NIC and so on. The yellow and orange computations are battery based and quite constant, just the smartplug has here interesting spikes.
Future
Might be interesting to look at the impact of kernel mitigations for the spectre/meltdown family of issues on consumption. Doing a load which allows also to measure performance would be interesting, to compute power efficiency. Also various tuning profiled (tuned) should have influence.
I should also do that for an Apple silicon system running Linux.. the one I played with in the past is now used by my parents.
Already now with consumption measurement, one could output how much co2 was exhausted if the energy was created in burning coal, and so on.
Ideas what would be interesting to measure? Please let me know.
Last modified on 2022-11-03